Live AI dashboards from business prompts

Natural language to business dashboards.

Buildify Labs turns plain-English business questions into interactive metrics, charts, comparisons, alerts, and decision-ready insights in one persistent workspace.

Workspace

Campus X Shoes Performance

Generated dashboard components

RevenueChartsInsights
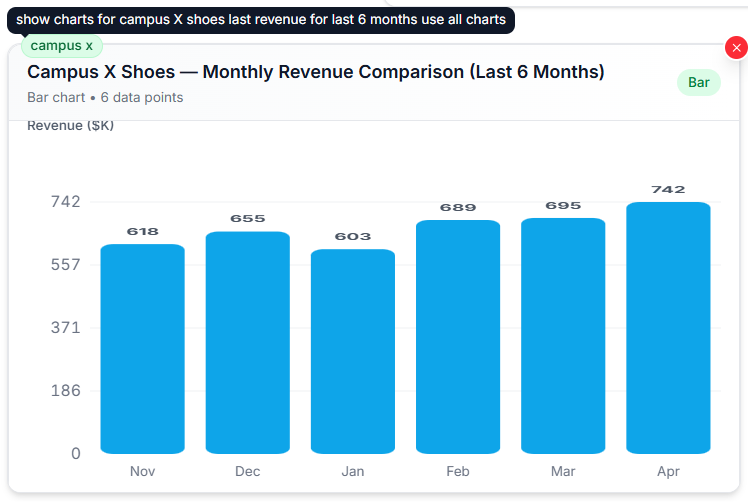
Generated bar chart in Buildify Labs
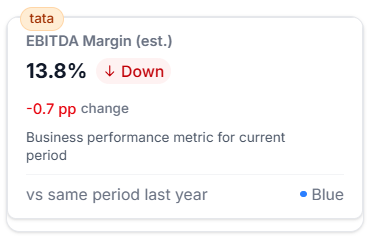
Generated metric card in Buildify Labs

AI insight

Revenue climbed into April while EBITDA pressure suggests a cost review.

< 10s

Prompt to dashboard

6

Core BI outputs

24/7

Workspace memory

Prompt To Workspace

The answer arrives already organized.

Each request is shaped into reusable dashboard blocks, so the output feels like a workspace instead of a one-off response.

Question

Show revenue trend, margin risk, and segment mix for Campus X.

RevenueMarginSegments

Metric

$742K

Revenue generated

Chart

6 mo

Trend visualized

Insight

Risk

Margin flagged

Product Showcase

Real generated analytics, presented as a focused workspace.

A single prompt becomes a review-ready surface with the charts, metrics, and narrative signals arranged where teams can actually use them.

campus-x-performance.workspace

RevenueMarginSegments

Campus X Shoes Performance

Generated from: revenue trends for the last 6 months

Analysis complete
Buildify Labs generated revenue comparison dashboard

Output

4 charts

Trend, mix, metric, comparison

Signal

+22%

April revenue lift

Review

Ready

Insight summary attached

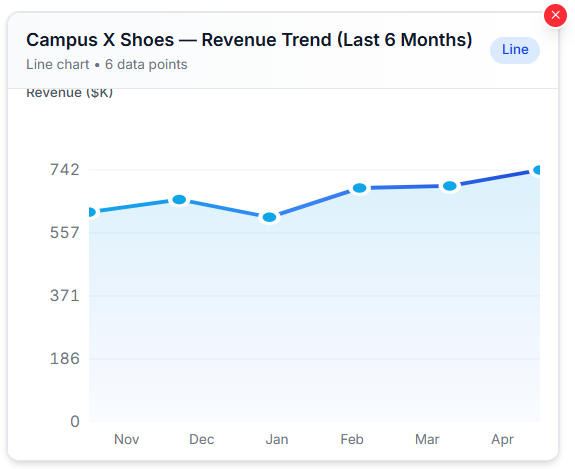
Buildify Labs revenue trend line chart

Trend analysis

Month-by-month movement with generated context.

Workspace block
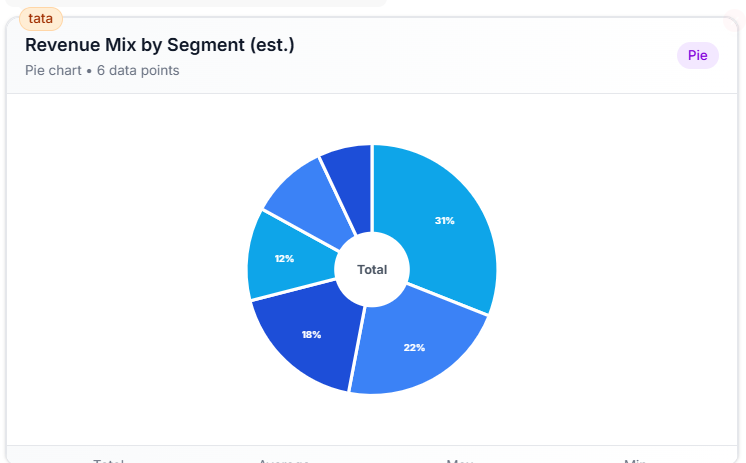
Buildify Labs segment revenue pie chart

Segment mix

Revenue distribution across business categories.

Workspace block

Features

The BI surface your team expects, generated from the conversation.

AI Chat

Ask business questions in natural language.

Move from vague operational questions to clear analytical components without writing SQL or building manual reports.

Show campus X revenue for the last 6 months.
Generated 4 dashboard components with trend, mix, metric, and comparison views.

Dashboard Generation

Every answer becomes a dashboard block.

Metrics, comparisons, charts, alerts, and summaries are generated as structured workspace components.

$742K

13.8%

+22%

Charts

Readable visuals for trends, mix, and movement.

Line, bar, and pie outputs make performance patterns easy to scan.

Insights

Context next to the numbers.

Surface deltas, risks, and plain-English interpretation alongside generated visuals.

RiskQ3

Margin dipped 3.2 pts while revenue increased, indicating spend pressure behind growth.

Workspace

Keep analysis organized across sessions.

Generated components persist in a focused workspace so teams can compare, resize, and revisit work.

1Revenue Trend
2Segment Mix
3Margin Alert

Export & Sharing

Package decision-ready views.

Prepare charts and insight blocks for stakeholder reviews without rebuilding the analysis from scratch.

Board review

Charts and insights ready

Share

How It Works

From a business question to a dashboard your team can use.

01

Ask the question

Start with plain English: revenue trends, margin risks, segment mix, or comparisons across periods.

02

Generate the workspace

Buildify Labs turns the prompt into metrics, charts, alerts, and summaries shaped for business review.

03

Review and share

Use the persistent workspace to compare outputs, preserve context, and move insights into the next decision.

Buildify Labs

Start with the question. Leave with the dashboard.

Use AI chat to turn business context into organized, visual analysis without leaving the workspace.

Open Buildify Labs